00 - Misc
ucla | CS M148 | 2024-23-31
Table of Contents
Residual Analysis
- in regression, plotting the frequency of residuals on histograms indicates how well a linear regression performs
- a good linear model should achieve a residual histogram that is normally distributed, preferrably right skewed (means left shifted)
- if residuals have no trend or there are just as many small residuals as large residuals => linear model doesn’t do very well
Feature Selection
Fwd/Bwd Feature Selection
Forward
- start with no features, train a model for each of the k features
- on a model for each combination of 2 features
- next iteration each combo of 3 features
- …
Backward
- start with training all
- at each iteration subtract 1 feature and train a model for each possible combo of features
- …
Correlation Screening for Feature
- correlation heatmap and bars
- choose features that have the highest absolute correlation
CART Algo for Decision Trees
- minimizes variance of child node classifications
- classification and regression algo (CART)
- for binary trees where L,R,P are right,left,parent:
- choose split that minimizes this variance
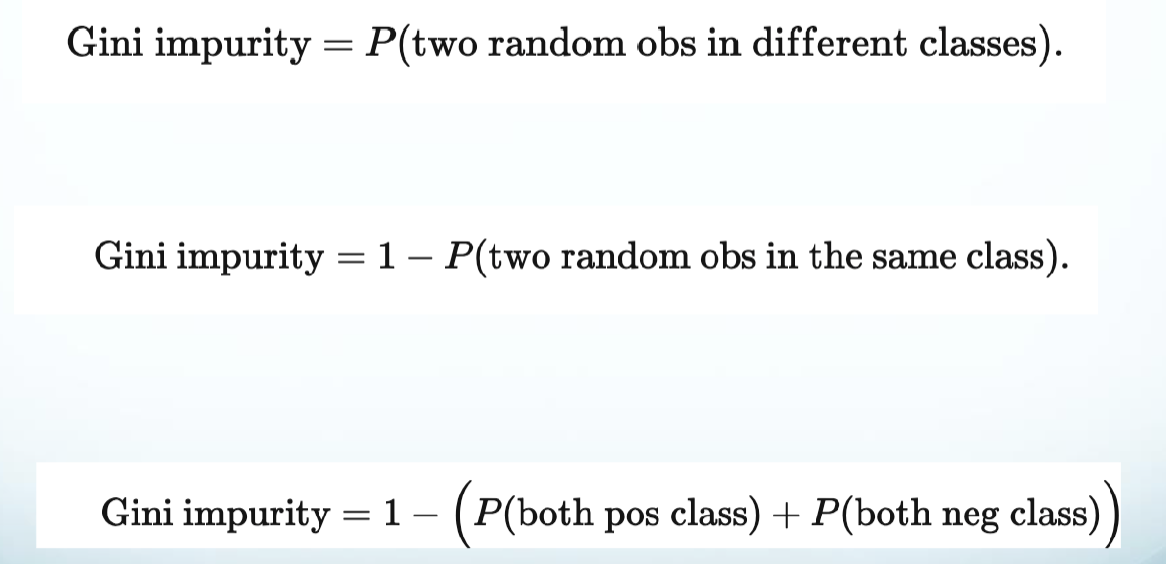
Gini Impurity
- relation to Bernoulli random variable variance (
- pure node contains data of the same class
- measures impurity of node and calculates probability 2 randomly chose datapoint with replacement are from diff classes
- maximum impurity is 0.5 => random (for binary class)